Search the site...

organization for human brain mapping
  • BLOG
  • Tutorials
  • Media
  • Contributors
  • OHBM WEBSITE
  • BLOG
  • Tutorials
  • Media
  • Contributors
  • OHBM WEBSITE

 BRAIN MAPPING


Interview with Tonya White

9/28/2020

0 Comments

 
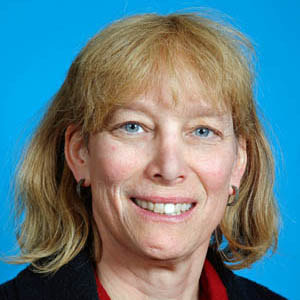
PictureTonya White
By Nabin Koirala

In advance of our scheduled launch of the upcoming Journal “Aperture” from the Organization of Human Brain Mapping (OHBM), we wanted to get up close with the first Editor-in-Chief of the Journal - Tonya White. Tonya is currently an Associate professor in the Department of Radiology and Nuclear Medicine and Department of Child and Adolescent Psychiatry in the Erasmus Medical center in Rotterdam, Netherlands. We discussed her personal journey in Science and her vision for the Journal.

Nabin Koirala (NK): Thank you so much for making time for this interview. To start, could you please introduce yourself to general readers who may not be scientists?

Tonya White (TW): That's always an interesting question because I have a number of different hats. I could say that I'm a developmental neuroscientist, a child and adolescent psychiatrist, a pediatrician or an electrical engineer. But what I've been mostly doing currently is what's called pediatric population neuroscience, which is actually the intersection between epidemiology and developmental neuroscience. The neuroimaging program I came to set up in Rotterdam is a large population-based study of child development. We’re currently collecting and evaluating more than 8000 MRI scans from children at three time points. Through the so called “Generation R Study” nearly 10,000 mothers who were pregnant between 2002 and 2006 were approached to participate in the study and the imaging is nested into a multifaceted epidemiologic study looking at many different aspects of child development.

NK: Wow, that's a large sample. So, what do you actually aim to find out from this huge cohort of 8000 scans?

TW: One of the things that's exciting about population imaging studies is that they have a direct translation into public health. So you can look at things such as exposures during pregnancies in mothers who smoke or don't take enough folate or who use cannabis and what happens in the brain because of these different exposures. Another aspect is that most studies using clinical populations look at the extremes within a distribution. Say, those who have a clinical diagnosis versus an overly healthy control group. Whereas, with population-based studies, you can also study individuals with subclinical symptoms i.e. who don't meet an actual clinical diagnosis but have some symptoms. Then you can ask the question, does the underlying neurobiology follow a continuum parallel with the clinical symptoms? If you have more symptoms, do you have more differences in the brain? Or are these differences related to a dose effect?

Lately, I've been really quite interested in the role of stochastic processes in development. We talk a lot about nature and nurture, but we don't often talk about chance. If you go back to the early 20th century, you see a whole dispute between Niels Bohr and Albert Einstein on the role of deterministic processes. So, I think we should also start a conversation of stochastic processes within the field of neuroscience.

NK: Thinking of Nature and Nurture,  how much genetic influence do you think there is in brain development?

TW: I believe it's largely driven by genes. I think genes have a huge effect in terms of brain development and the other factors like the environment and stochastic processes have more subtle but real and measurable effects. As an example, in several of our studies, what we've looked into is the polygenic risk for different psychiatric disorders; we’ve  shown several genes contributing to psychopathology.

NK: This is fascinating, but I have to admit I am even more curious about your Journey in Science. How did you end up doing neuroscience from being an Electrical Engineer?

TW: Oh, that’s a long but I guess a good story. Anyway, I’ll try to shorten it as much as I can. My undergraduate degree was in electrical engineering with a focus in biomedical engineering. I started engineering because I was good at math and my father, who was an engineer, encouraged my older brother, myself, and my younger sister to go into engineering. During my bachelors, about half the people in my engineering class were looking into jobs related to defense. But I was rather interested in medicine and the human side of things. So, during my graduate years, I started looking for options and my interest at first was in bioengineering and working with prosthetic devices. This might also have to do with the fact that I really liked my summer job working on the Utah artificial arm during my undergraduate years. So, while continuing my graduate program in Engineering at the University of Illinois, I began medical school. By my third year of medical school, I would have said that I was planning to go into pediatrics. However, during my fourth year of medical school, I had a chance to spend a month at Brown University, rotating through child Psychiatry at Bradley hospital. After that, I became very excited about child and adolescent psychiatry. I went back to my Dean and requested that he re-write his letter for me to apply to the so-called triple board program, which involved pediatrics, psychiatry and child psychiatry. It’s a natural step to become interested in the brain through psychiatry.

Because of my clinical experience during my residency, I became interested in autism. I went to the University of Iowa for a neuroimaging postdoctoral research fellowship with Nancy Andreasen on schizophrenia research with the goal of also being able to work with Joe Piven on neuroimaging in autism spectrum disorders. But shortly after I moved, Joe moved to North Carolina, so I then focused on schizophrenia and moved to the University of Minnesota to set up a youth psychosis program. I spent about four days a week at the Center for Magnetic Resonance Research at the University of Minnesota. Then in 2009 I had the unique opportunity to set up the neuroimaging program in Rotterdam.

NK: Wow! that’s quite a story. So, having three different degrees, how much do you think this vast intersection of knowledge has helped you in your academic career?

TW: I can say engineering has been extremely helpful, particularly for the intersection between neuroimaging and medicine. To give an example, there are lots of new methods that are proposed regularly. Most of them are cool, and sometimes neuroscientists apply them without actually thinking about the assumptions from a neuroscience perspective. So, the engineering degree has given me the ability to understand what's involved in the assumptions of these methods, to have a different overarching view to better apply them in addressing my research questions. Even though I do think that having in-depth knowledge in multiple domains is very helpful, I also like the kind of hybrid courses currently springing up in universities, like medical technology, computational neuroscience etc. I believe these courses create bridges between medicine and different aspects of technology.

NK: Maybe one last question regarding your academic journey so far. You were a faculty member in Minnesota for around eight years. What made you switch to this position in another  continent?

TW: I would say a combination of things. A key factor was the generation R Study, which I thought was fascinating. Being able to infuse neuroimaging in that study seemed like a great opportunity. Among other factors, there was a lack of NIH funding under George W Bush.  NIMH funding during his period went down to as low as 3-5%. I also had a great experience living in Europe during five years of my childhood with my parents in Germany. So I think it was more the opportunity in Rotterdam that had a pull, as I did very much enjoy being at the University of Minnesota and being close to family.

NK: So let’s focus on Aperture, could you tell us a bit more about its formation: the concept behind it and what this new journal brings in the sea of others? What’s different about it?

TW: I was the secretary on the OHBM Council when it was first introduced as a possibility by, I believe, Martin Lindquist. He said “wouldn't it be nice if we had a mechanism to publish these educational articles (the COBIDAS document) that are good for the OHBM community and the wider neuroimaging scientific community?” JB Poline then picked up on that and, together with Peter Bandettini and a group that now form the Aperture Oversight Committee, became the driving force behind Aperture.

As to what sets Aperture apart, there's a couple of different aspects. One is the promotion of open science. The journal itself will be open, but it’s not just the research articles that could be open access but also what we call research objects like scripts, data sets, educational materials etc. Even educational material that you would normally see at one of the educational courses in OHBM could be embedded in something like Jupyter notebooks etc. Second is the low publication cost. Given the very high ‘open-access’ publication costs in many journals, these costs can be prohibitive for researchers in low- and middle-income countries. Hence, it is getting more and more difficult to publish research from those countries. I think we're all together in this whole research mission to understand the brain in the hope that people's lives will be improved, so an initiative in that direction is definitely one of the primary goals of Aperture.

NK: Great. Coming from one of those low-income countries, I can totally relate to what you are saying. Based on an OHBM survey on Aperture, a large proportion of participants said that they would be mostly interested in publishing codes or tutorials. How do you plan to review and manage that given the updates needed for those articles?

TW: Science is dynamic, it will change. So, we are more focused on the initial review process rather than the eventual updates. Major updates could be submitted as updated research objects to Aperture and given a new DOI. We've discussed several ideas on how to review something like a code or a script. Even though there is not yet a concrete plan, one of the things I've been thinking is that perhaps it would be good to have teams who would get together to check the scripts and run the code and see if it does what it says it can do and what issues may arise while testing the code. We will start with some test cases to try some of these ideas from our editorial team and see how it goes. But the goal is eventually these types of research objects will be published and receive a DOI.

NK: That sounds fantastic. Among one of the active debates that's going on in science these days is about diversity and inclusion. Do you have some plans to enhance that in Aperture?

TW: Definitely. Step one, I will be looking at diversity within our editorial board, making sure that we have a diverse group covering different domains. And then it's important to consider diversity not only in terms of gender, race, ethnicity, sexual orientation, gender identity, disability, language, etc. but also the diversity in methodologies and types of approaches to science. Diversity is perhaps one of our greatest gifts that we currently have in academics, hence I would definitely try to promote that from every aspect possible.

NK: As an editor-in-chief have you envisioned a certain direction for the Journal in the next five years or so?

TW : One of the advantages of being under the umbrella of OHBM is that we can pursue only those research objects of high quality. It might not be straight forward at the beginning given we don’t yet have an impact factor or indexing in PubMed. We're working together to provide a venue for people to submit types of research objects that may not fit in other types of journals. The general goal would be to establish Aperture as a quality journal which is not for profit, and becomes a platform for diverse articles relevant to the field of neuroimaging.

NK: Have you thought about a particular model of review process? Would the reviewers be open after acceptance like in Frontiers? Would the process be double-blinded?

TW: We've discussed this and there are many advantages and disadvantages of both processes. For example, someone junior in the field who is reviewing a research object from someone more senior in the field may not feel comfortable publishing their name. So, for now the idea is to make it optional for the reviewer, having the ability to opt out of being open. Regarding the double-blinded process, we have not yet decided upon that.

NK: Before we conclude I would like to ask some personal questions which I am pretty sure is interesting for many of us. Let’s start with your hobbies?

TW: Actually, this afternoon I am planning to go climbing at a climbing hall. But apart from that probably the thing I most like to do (in the winter) is to ski. I'm a member of a cross country ski group. Here we go roller skiing in the Netherlands. I also enjoy biking and most things outdoors like canoeing, hiking etc., which I do a lot with my family. I’d rather listen to lots of audio books than read them. Because I read so much for my work, sitting and reading books feels more like work than free time, so I just listen to audiobooks while doing other things. Actually, listening to books on tape in Dutch has really helped to improve my Dutch language skills.

NK: Are you already a fluent speaker?

TW: Much of my interactions with my Dutch colleagues is in Dutch, but I am no way near perfect. Still a lot to learn.

NK: Having a chance of working both in the US and Europe, do you feel that there are some differences in terms of research culture across the continents?

TW: Most of the important things are very much the same, but there are things that are quite different. For example, most of the research in the US is done by the PIs (Principle Investigators) and research assistants, at least on the medical school side of things. But here in Europe most of the research is driven by PhD students. Also in Europe during summer the population of the research unit decreases by 75%, as most people go on vacation for extended periods of time and they're expected to do so. You are interviewing me in the summer [laughs]. I like the quietness of the summer to get work done and then I go on ski vacations in the winter.

NK: Being an expert in the Brain, I am very curious to know: if you were to be a brain region, which one would it be?

TW: What a great question! I think probably the hippocampus because it integrates multimodal information. And that's kind of sitting between multiple disciplines. That's kind of what I do.  I actually believe more in connected regions rather than one specific brain region, but I guess I can't call connectivity a region, can I? [Laughs]. Probably another favorite would be an action potential. Potential for action related to Aperture. [Laughs]

NK: Three key ideas for early career researchers?

TW: 1. Think outside the box. Because you should always remember that if we, as senior researchers, had already figured it out, you wouldn't have a position. So if we continue doing things the same way that we're doing, it's possible that we miss something. So make sure that you think outside the box.

2. Persistence. As an example I would say, as a researcher you need to get used to rejection. When your first grant gets rejected and another grant after that, the ones who persist are the ones who are going to be successful.

3. Play well on the sandbox. We're all in this together to hopefully make life and this society better for all of us. So we all should remind ourselves of the real reason why we do science.

NK: Great suggestions. Thanks again for taking time and making it such a great interview. 

Learn more about Aperture here.


0 Comments

OHBM Oral History Series: John Mazziotta

9/14/2020

0 Comments

 
by Nils Muhlert
Picture
John Mazziotta is Professor of neurology, CEO of UCLA Health, and vice chancellor of UCLA health sciences. He was also a founding member of the OHBM. He co-authored the first book on whole-body, cross-sectional anatomy using CT. He’s been involved in the first PET studies in normal subjects and with patients with epilepsy and Huntington’s disease. He was the principal investigator of the ICBM brain atlas, a key tool for brain normalisation. We interviewed him as part of our OHBM Oral History series, to find out about the early days of PET, (f)MRI and the inception of OHBM.

Nils Muhlert (NM): Thank you very much, Professor Mazziotta, for joining us today. I'd like to start by asking you about your background: Why and how did you become interested in neuroimaging?

John Mazziotta (JM): Well, I wanted to be an architect. That didn't work out because I spent a lot of time in Manhattan with architects when I was an undergraduate, and they didn't seem very happy. I like science and went into a lab where I was doing early molecular biology and that was interesting but very isolating. I thought, “Well, I'll go to medical school.” I hated medical school, memorizing bones and things of this sort. Ultimately, I met a neuroscientist in the medical school. The school also had a very active biophysics department and were building the first CT scanner that could image outside of the head. This is now mid-1970s. I got involved in that project and we physically built that machine, soldering wires. We had a functional scanner that worked anywhere in the body.

I decided I would become a neurologist, moved to Los Angeles and UCLA and immediately met the group that had moved from Washington University in St. Louis. They had been involved in the development of PET and all worlds connected, so I got involved in research with PET and then MRI.

NM: Should I ask who the neuroscientist was, that you met during your med school years?

JM: The neuroscientist in my medical school years was a woman named Betty Hamilton. And ironically, Peter Fox and I were in the same medical school class, and there were other neuroimagers in medical school with us. It was an interesting coincidence. The seeds were set there.

NM: And what was it about neuroscience and neuroimaging that really attracted you?

JM: Clinically, it was the approach to the patient, the gathering of the data, the deductive logic of coming to a diagnosis and then having confirmatory tools like imaging that could show you structural and/or functional abnormalities, confirming whether that diagnosis was accurate or not.

NM: And what do you see happening with neuroimaging in the US nowadays?

JM: Obviously there's been a big shift to MR-based strategies rather than PET. But now we're starting to see a resurgence of PET to study patients with neurodegenerative and psychiatric diseases. In the mid-1980s I was confident that psychiatric disease would be completely understood by PET because they were chemical disorders. You could give somebody chemicals and they would become psychotic or delusional or hallucinate. And you could take a patient who had mental health issues and give them medications and they would get better: it was a chemical issue, no structural changes. But after 40 years of scientists, very diligently, pounding away and making ligands and imaging patients, we still have not provided, to my mind, actionable insights in mental illness through imaging.

NM: And do you think there will be breakthroughs over the next 20 to 30 years? Is there anything you'd peg your hopes on?

JM: I’m just as confident now as I was then [laughs]. It's a tough problem and a very expensive problem. When developing a new ligand it might be useful if, as a community, we encouraged key places to be the factories of ligand development. It's so expensive, and like CERN or other high energy physics projects, talented scientists could go there, do the work and then return to their home institutions. Once proven, the recipes for the ligands could be distributed widely.

NM: That's an excellent idea, to really pool the resources and expertise. Going back to your own work, what research or other contributions are you most proud of?

JM: Always a humbling question. My research with PET began with studying normal individuals. We studied the visual system. Our first papers were on visual responses to different types of stimuli, sensory deprivation, auditory stimulation, and a variety of various states in normal subjects. That was very exciting. Every time we did a scan, it was a new day. You never knew what you were going to see. It was an exciting time.

On the clinical side, I was involved in the first PET studies of patients with epilepsy, the first studies of patients during seizures, Huntington's disease and depression.  Combining genetics with imaging, in the Huntington study, was a good example of developing probabilistic approaches to individuals who are at risk, then testing them genetically and seeing the outcome and looking at the scan. Those were also exciting times, in our collaborations with what was then the Hammersmith group in London; ultimately with Karl Friston, Richard Frackowiac and the others, Terry Jones in that group, and our colleagues in UCLA with Mike Phelps and Henry Huang, myself and some of the fellows that I had, Roger Woods and Scott Grafton. We carried out a lot of the early work on blood flow measurements with that combined group.

NM: And many neuroimagers will know of the ICBM brain atlas. You had a pivotal role in the development of that. How did it come about?

JM: That was a painful part of history. We were all struggling with how to normalize data, in our own labs, among individuals within a modality and then across modalities, and then ultimately, to pool data from multiple different laboratories. And it was clear that this was an enormous problem, and it was unlikely that one laboratory on its own would solve it.

I invited to Los Angeles, where I was then working with Arthur Toga, a group of the individuals around the country and around the world that were doing this kind of work and were frustrated by the fact that the problem was a difficult one. We all worked together for a couple of days: Peter Fox, Alan Evans, the people I mentioned, some individuals from Europe and Asia. We were all natural born enemies. We're all vying for the same funding dollars, all doing a lot of similar work. There was a lot of posturing and opening remarks. In the end, we emerged from those two days saying the only way to really solve this problem is to do it together. And if we did it together, we'll actually get it done and would emerge with something that makes sense.

Later, we teamed up with other groups, particularly the group from Jülich, who did all the amazing work on the histology. It was a big program, Arthur Toga perfected the sectioning of human heads; that data went to Germany, to Karl Zilles and Katrin Amuints and their talented teams and went on from there. It's still going on today with the BigBrain project and the collaborations between McGill and Jülich. So that was another satisfying addition to the contributions by the group. That group continues to meet, always in Hawaii, always in the first week of November, this year will be the first exception in something like 26 years.

NM: It's a great example of fruitful collaboration, not just between national institutions, but across the globe. And you were also involved in the creation of OHBM. What was that like? And what did you imagine OHBM would be like?

JM: It was less about what it could be, but what it would eliminate for us. We were at a meeting in San Antonio that Peter Fox hosted. I was there, Arthur Toga, Alan Evans, Bernard Mazoyer. We were bemoaning the fact that we were all going to all these meetings every year, the cerebral blood flow and metabolism meeting, this meeting, that meeting, meetings about MRI, meetings about PET, meetings about everything. It didn't make any sense because most of those meetings had nothing to do with what we were interested in, which was trying to map the human brain.

Sitting around in a little conference room, the idea emerged,: "Well, why don't we just have a meeting about what we're interested in and not have to go to all these other meetings?" So everybody said, "Yeah, that'd be great. But it's going to be such a pain to do and who's going to front the money." But people were compelled to do it just because they were so frustrated with the current situation. And when we thought about how much money was wasted sending fellows and students and everybody else to all these other meetings that were low yield, we decided we'd roll the dice. Bernard decided he would really roll the dice and put a deposit on a center in Paris. And the rest is history.

NM: And how did you think it would evolve over the years?

JM: Well, we didn't know if it would work at all! So initially, it was a matter of trying to stabilize the finances to the point where we could at least be confident that if we advertisd the next year, there would be enough funding to get it to happen. The more grandiose envisioned something more like what the reality is now, that there would be books and journals and a subdiscipline of neuroscience that was basically doing this. We also felt that it would be important to have educational components: that a graduate student in psychology might not necessarily be exposed to the physics of the machines that was generating the raw data, or that a mathematician who was doing modeling wouldn't necessarily understand neurophysiology and neuroanatomy. And so once it was clear that we could sustain the meeting, then the next part was to make it something that had value not only as an information exchange but also as an opportunity to provide training to the field.

NM: And thinking of your own involvement with OHBM. What have you found most rewarding about that?

JM: Walking into the rooms with the posters or the lectures and seeing all those people, and the energy of the students and the fellows and people who are seeing their careers and their professional motivation, joined by colleagues who were like minded in the same place. That's very satisfying to see. From five people sitting in a room to thousands of people who are all thinking about these problems and trying to make progress.

NM: Definitely! Are there any experiences you've had attending OHBM that really stand out?

JM: One of the things that we did for a while was Richard Frackowiak and I would summarize the whole meeting at the last session in 30 minutes. So we had to somehow boil down 1000 presentations into 30 minutes. That was always challenging and fun. And I have to say it does focus your attention on the content of the meeting, rather than just cruising around and talking to people and reading a few posters. For the first 10 years, we had an “L & L party” with people from Los Angeles & London labs. We would jointly fund that party and it was one night a week and we'd bring the entire lab to these parties. We had them on boats, nightclubs, bars - they were all over the place. That's evolved into the social events that are on the different nights of the meeting,

NM: So that's been there since the very start?

JM: The first one.

NM: Brilliant. And have you seen any changes in how the meetings run or different angles coming into it that perhaps weren't there at the start?

JM: Well, when things are small, they're easy, everybody's in one room. And as things grow, they become more specialized and subcategorized. Then you have to pick and choose which things you want to attend or not. That's a natural evolution of any process like this. But I appreciate the fact that the named lectures and the other components have been maintained as unifying parts of the meeting. Attendees really look forward to those sessions and everybody's there.

NM: And a final question then. Not an easy one to end with! But, what do you see as the future for neuroimaging?

JM: [long pause] Notice the long pause [laughs].

The future is bright. But the pressure will be there to deliver on the clinical side, truly valid biomarkers from imaging. We don't have any of those yet. If you really look hard, and ask the question: if we have this imaging result, then this is the diagnosis. Those are few and far between, from functional imaging. That will be the question that will be put out there. Can you do that and if not, then why should we fund it? So that's one.

The second issue was the one I mentioned earlier: insights into purely functional and chemical illnesses like mental illness. And that's a big lift, and an important one. And similar one will be neurodegenerative diseases.

Then the most profound and the most interesting question is: how does the brain work? I would envision in the future, that through techniques we don't know about today or in some parts, extrapolations of some of the physics of MRI, that we'll get to the point of actually being able to image neural conduction, synaptic activity. It wouldn't be microscopic, but in large ensembles. With improved temporal resolution, we'll be able to understand the choreography of signaling in the brain. Once that level is achieved and massive data can be managed in four dimensions, then the insights will come more rapidly.

NM: So there's bridging of scales.

JM: Yes both spatially and temporally.

NM: Fantastic. Professor Mazziotta, thank you so much for taking the time to speak to us. It's been a pleasure hearing about your history with OHBM. Thank you very much.

JM: Thank you.

0 Comments

On-Demand How-To: Measuring GABA in the Brain with MR Spectroscopy

9/1/2020

0 Comments

 
Authors: Katie Williams, Ilona Lipp, Mark Mikkelsen
Infographic: Roselyne Chauvin
Expert editors: James Kolasinski, Paul Mullins
Newbie editors: Curtiss Chapman, Yana Dimech

Introduction
The noninvasive imaging tools that we Human Brain Mappers apply are most often being used to research brain structure and function. Neurotransmitter systems are something that we are aware of and use to take into account when coming up with hypotheses or interpreting our findings, but rarely make the direct subject of our investigation. Most of us have probably heard of GABA (gamma-aminobutyric acid) as the principal inhibitory neurotransmitter that is used by many interneurons. That we can also measure GABA in vivo with MR spectroscopy (MRS) is maybe less widely known. While this biomedical imaging tool opens many doors for neuroscience, measurement of GABA using MRS is not broadly used yet, possibly because special sequences and analysis methods are needed. At the OHBM Annual Meeting in 2019, for the first time, an educational session on GABA MRS was held. This post summarizes what was taught about the most important things you need to know if you’re considering GABA MRS for your research.
Picture
Why should we care about GABA?
As GABA is an inhibitory neurotransmitter, an intuitive way to think about it is that it can regulate neuronal firing, allowing the establishment of complex neural circuits and ensuring that the brain does not become “overactive”. This intuition is in line with the fact that drugs that act on the GABAergic system are traditionally used to treat anxiety and pain. In her video, Caroline Rae (from the beginning) emphasizes that when considering GABA, one should also consider glutamate, the excitatory neurotransmitter. She explains how GABA and glutamate are actively coupled at the synapse (min. 10:55). The ability of GABA to regulate glutamatergic firing makes it a neurotransmitter that is likely involved in many biological processes, one of them being brain plasticity, or the brain’s ability to structurally react to new situations (as explained by Charlotte Stagg from min. 1:55).
Picture
Charlotte explaining the role of GABA in brain plasticity
How can we measure metabolite concentrations with MRS?
To understand the physical principles that give rise to MRS, it is helpful to take a few steps back to the basics. Robin de Graaf succinctly reviews (from min: 2:30) how nuclear magnetic resonance (NMR) in its essence is all about separation and detection of frequencies. In conventional MRI, we create a signal by interacting with the resonance frequencies of protons in a nucleus of interest – most typically that of hydrogen around 127 MHz at 3T and 298 MHz at 7T. MRS differs from typical MRI because it relies on something called the chemical shift effect. What does chemical shift mean? Depending on the chemical composition of a given molecule, the constituent protons experience different electronic shielding effects, resulting in slight differences in their resonance frequencies, which translates into many peaks appearing as an MR spectrum rather than a single clean signal peak at that free molecule’s resonance frequency. This is called chemical shift, because the biochemistry and environment of the molecule lead to a slight shift of its signal in the frequency domain. So, if one were to effectively “zoom in” on the hydrogen proton signal at 298 MHz, for example, we would see that the signal is actually composed of many smaller peaks in the range of a few hundred Hz surrounding this frequency in the MR spectrum. This signal reflects all MR-visible hydrogen-containing molecules in the sample. Since the water signal (coming from the hydrogen protons in the water molecule) is so much stronger in intensity than these other peaks, frequency-selective water suppression pulses are integrated into MRS pulse sequences to help reveal the less intense peaks that we are interested in. After showing us a zoomed-in shot of several peaks (screenshot below), Robin explains (from min. 4:00) how electronic shielding and chemical shift lead to consistent, exact locations of the peaks of different chemicals – or metabolites – in the MR spectrum. As resonance frequency depends on the field strength, Robin goes on to describe how moving away from frequency-based units to a parts-per-million (ppm) scale allows metabolite measurements to be more easily compared across field strengths (from min. 6:52).

Picture
Robin showing us resonance frequency spectra of different nuclei
Ok, what now?
When combined with a pulse sequence with spatial localization, such as MEGA-PRESS or MEGA-(s)LASER (which Robin describes later, min. 17:56), a metabolite spectrum can be acquired from a volume of interest in the brain. The chemical shift effect holds true for all MR-detectable nuclei and, as such, for a long list of metabolites composed of those nuclei, including GABA. For this reason, many challenges that we face in measuring GABA concentrations apply universally in MRS. Clever use of relaxation properties and nuclear coupling effects give us a few solutions, however.

Why is it challenging to measure GABA concentration with MRS?
If specific metabolites like GABA can be measured with MRS, why are we not using it in every neuroimaging study? To be completely forthcoming, there are a number of challenges in conducting successful MRS measurements. Luckily, there are some options to deal with each of them. In spectroscopy, the signals we detect are very weak, so we have to run several hundred repeated acquisitions to obtain an acceptable averaged spectrum for quantification. Another way to boost SNR is to acquire spectra from larger voxels. Choosing an extra-large voxel size (by MRI standards) for higher SNR, however, is not an ideal solution because of heterogeneous tissue compositions in a voxel, and GABA concentration varies across different tissues. Ashley Harris explains that it is important to correct your measure for its tissue composition (from min. 8:53), because of known differences in GABA concentration in gray and white matter.
Given the low SNR of metabolite signals, it has been common for a long time to use single-voxel MRS acquisitions. This is the reason that sometimes spectroscopy is not always categorized together with conventional MRI as a true brain imaging technique. However, using specialized pulse sequences, it is possible to acquire data from more than one region of interest using dual-voxel MRS, for example, which Muhammad Saleh describes in his video (min. 20:40). It is worth mentioning here that MRS imaging (MRSI, so spatially resolved MRS) approaches do exist, with which multiple voxels are acquired from a cubic volume, for example 3D MRSI can reach whole-brain coverage with a 14 × 14 × 12 voxel matrix size and 200 × 200 × 170 mm field of view (2.89 mL nominal voxel resolution), and technological advances to improve them are continually occurring.

What is the problem with spectral overlap?
What might be considered the biggest challenge for accurate metabolite measurements is spectral overlap. Given that so many biologically relevant molecules contain hydrogen protons, many with similar hydrogen structures, their signals will overlap, making it hard to get an accurate quantification of individual peaks that we care about, as Robin describes (from min. 9:30) in his video. If we cannot isolate the GABA peaks, then we cannot quantify them easily! 

In addition to the signals of identifiable metabolite peaks like creatine and glutamate that overlap with the GABA peaks in the spectrum, an underlying assortment of signals of broad peaks originating from macromolecules is present. (Here, macromolecules refer to a host of large molecules, including proteins, that differ from the smaller molecular structures such as GABA). The macromolecule (MM) signal is a biologically generic signal detected by in vivo MRS that usually consists of about ten peaks spread across the acquired spectrum. The MM signal can be attenuated using several acquisition solutions, which we describe below. However, it is important to note that the MM signals cannot be 100% removed, and their contribution is always present, to some extent, in a GABA measurement. There are several different options to approach spectral overlap, including moving to a higher field, like 7T, which improves the spectral resolution, meaning that the peaks are more spread out, and reduces the amount of overlap that occurs between them (an expensive solution, Robin notes, min. 10:50). Another possibility is to take advantage of T1 and T2 relaxation differences of different metabolites and use inversion recovery and spin-echo sequences in your experiments (as Robin describes, min. 11:46).

What can we do about this spectral overlap problem?
By far the most popular method for dealing with spectral overlap, and the most discussed technique for GABA quantification in the educational session, is the spectral editing approach: The same physical principles of nuclear interactions that make tiny changes to local magnetic environments and allow us to accomplish chemical shift imaging (i.e., to obtain spectra) offer a solution to spectral overlap. Nuclei that are chemically bonded to the same molecule, and thus generate multiple peaks for that molecule, are scalar-coupled, which, in quantum mechanics terms, means manipulation of one signal of a molecule also modulates the other signals of the same molecule. This phenomenon can be used to selectively manipulate overlapping signals and acquire the signal of interest. The figure above shows that GABA is composed of three major signals that are scalar-coupled to each other, and that glutamate and creatine have peaks overlapping in some locations. From min. 13:11 in his talk, Robin explains scalar coupling and how frequency-selective inversion pulses can be used during acquisition to modulate the signal of scalar-coupled molecules, but not the uncoupled ones. This is known as “editing” an MR spectrum.  Using this technique, one can perform paired experiments, one with and one without the frequency-selective editing pulses, to recover the signal of the metabolite of interest. This technique, known as J-difference editing, is a powerful MRS technique used for measuring GABA in the brain. It should be noted that while scalar coupling helps us to more specifically acquire our signal of interest, co-editing always occurs, and attention should be paid about which molecules are being inverted. Robin describes a simple pulse sequence for a full J-difference editing experiment, using GABA as an example (from min. 17:56), while Muhammad Saleh speaks extensively in his video about special GABA editing sequences and ways to speed up editing experiments to increase the information extracted from the data acquired. And that brings us back to the topic of challenges in measuring GABA: applying solutions to acquire good spectra significantly increases scan duration, giving rise to more temporal instabilities in the signal, specifically frequency offsets. Frequency offsets are shifts in the main magnetic field that most often occur either because of heating/cooling of the gradient hardware elements in the scanner or bulk participant head motion. In her talk, around 24 minutes into the video, Ashley discusses this problem and how sometimes it can be fixed retrospectively through frequency alignment.
Picture
Robin explaining the J-difference strategy of measuring GABA
What do I need to consider when setting up a GABA-edited MRS acquisition?
There are some essential questions to answer when setting up a GABA-edited MRS experiment. Of course, the first is where in the brain you want to measure GABA. For hypothesis-driven studies, this will be determined either by the functional neuroanatomy of the aspect of brain function being studied or by the regions implicated in the neuropathology/pathogenesis of a particular brain disorder/disease. It is worth reiterating that, given the low SNR of the GABA signal, the size of the volume of interest will be on the order of cubic centimeters. Thus, one will need to be aware of the limitations on the specificity of where in the brain GABA will be measured. For GABA editing, voxels tend to have around 27 mL tissue in them (e.g., 3 × 3 × 3 cm3) in volume to attain reasonable SNR. In the MRS literature, the voxel size is often reported in volume, as this is the relevant factor for SNR.

Oh, such large voxels!? Can I not just go to 7T and get a better spatial resolution?
Should it be possible (and desired) to perform MRS experiments at ultra-high field (>3T), then the benefits of a higher field strength would alleviate some of the challenges of MRS acquisitions. Aside from the associated increase in inherent SNR of metabolite signals, and the already mentioned increase in spectral resolution (the separation of peaks in the spectrum), high field measurements allow improved selectivity of editing pulses. These advantages of ultra-high field MRS make it more feasible to detect GABA without using editing. Nevertheless, editing at 3T remains the most commonly used approach for measuring GABA that you will encounter in the literature.

Another consideration for increasing SNR is scan duration. In edited MRS, each acquisition is repeated (usually several hundred times) in order to perform signal averaging to improve the SNR of the detected metabolite signals. As Ashley Harris explains in her presentation (from min. 19:43), the question of how many averages are needed (how many times to repeat the measurement in one scan acquisition),(i.e., how long to scan) will depend on voxel size, the scientific question being asked, and the region in which you are scanning. Some regions like the occipital lobe provide good SNR and therefore allow you to scan for shorter periods. In contrast, other regions like the temporal lobe are more challenging to acquire high-quality data in and necessitate collecting relatively more averages.

Anything else I need to think about?
It is also worth considering the order in which you run your different MRI/S acquisitions in a given scan protocol. When conducting a study, it is quite likely you will be acquiring a variety of scans, such as fMRI, diffusion MRI, and MRS. Sequences that involve rapid switching of gradients (e.g., EPI and DWI) will lead to heating and subsequent cooling of the scanner’s hardware elements. This causes shifts (or drift) in the B0 field (and thus its frequency) that can have a considerably detrimental effect on edited MRS acquisitions, which require frequency stability to ensure the narrowband frequency-selective editing pulses perform as intended. Performing MRS acquisitions before any scans that make use of high gradient duty cycles can help lessen the impact of frequency drift on acquisition performance. Also, the use of prospective and retrospective frequency alignment methods can mitigate the detrimental effects of frequency drift on spectra. Ashley also talks about this in her presentation (from min. 22:30).

How do I know whether the quality of my spectra is good enough?
Several signal artifacts can lead to poor quality of MRS data. An excellent place to start is by reading this paper, which describes in detail the kind of artifacts one would see in corrupted MRS data. A full description of artifacts is beyond the scope of this blog post. Still, one thing in particular that can significantly degrade the quality of your spectra is participant motion. The comparatively longer scan times of edited MRS acquisitions, unfortunately, provide more opportunities for a participant to move and worsen spectral quality. Some simple steps that can be taken to prevent motion artifacts include emphasizing to participants the importance of remaining as still as they reasonably can when they hear the scans running and acquiring structural/fast localizer images and MRS data consecutively so that voxels are placed as accurately as possible given participants’ current head position.

The act (art) of rating the quality of MR spectra can be challenging to those new to MRS. Since MRS is methodologically distinct in several important ways from MRI, quality analysis may be less intuitive to new users who are more familiar with the latter technique. Typically, a good approach to quality analysis (when possible) is to consult a colleague (internally or externally) who has experience with MRS. A review of 2–3 pilot datasets can go a long way to establishing the predicted quality of MRS data for a proposed study. When an investigation is underway, it is highly beneficial to review data as they are collected. Continual reviews of data can prevent situations where a series of datasets have been acquired with significant artifacts that would lead to their removal from further analysis, which could potentially seriously undermine the success of a study.

Ok, so now I have a spectrum, but how do I quantify GABA?
Once you have acquired some GABA-edited MRS data, you can quantify the GABA from the data you have collected. There are some software analysis packages available to users that can quantify GABA from edited MRS data. These include Gannet, jMRUI, LCModel, TARQUIN and, most recently, also FSL. Each has its own strengths and weaknesses and particular learning curve, but each will allow you to derive a quantified measurement of GABA from your MRS data. The GABA signal is either quantified in the time or (more commonly) the frequency domain, where either the amplitude or the area of the GABA signal is used to determine the concentration (as concentration is proportional to signal amplitude or area). While a description of each package is beyond the scope of this blog, readers are advised to read the following papers for further information:

Edden RAE, Puts NAJ, Harris AD, Barker PB, Evans CJ. Gannet: A batch-processing tool for the quantitative analysis of gamma-aminobutyric acid-edited MR spectroscopy spectra. J Magn Reson Imaging. 2014;40(6):1445-1452

Provencher SW. Estimation of metabolite concentrations from localized in vivo proton NMR spectra. Magn Reson Med. 1993;30(6):672-679

Stefan D, Cesare F Di, Andrasescu A, et al. Quantitation of magnetic resonance spectroscopy signals: the jMRUI software package. Meas Sci Technol. 2009;20(10):104035

Wilson M, Reynolds G, Kauppinen RA, Arvanitis TN, Peet AC. A constrained least-squares approach to the automated quantitation of in vivo 1H magnetic resonance spectroscopy data. Magn Reson Med. 2011;65(1):1-12

Ok, so now I have a GABA concentration measure. But what does this measure mean?
There are two things to consider. First is the specificity of the GABA signal we are detecting. As Ashley describes (from min. 3:25), the GABA signal is contaminated by a co-edited MM signal that leads to the observed GABA signal at 3 ppm being ~50% MM. For this reason, it is conventional in the field to define edited GABA measurements acquired by standard editing as “GABA+” measurements, to acknowledge the MM contribution. The majority of studies in the literature applying GABA-edited MRS will have acquired measurements of this sort. It is, therefore, important to recognize this limitation when setting up an experiment (it may impact the interpretation of your findings). Alternatively, one may implement an MM suppression technique that removes the MM signal underlying the GABA+ signal so that measurements are a “purer” measure of GABA. However, this comes at the cost of reduced SNR (from min. 5:00).
Picture
Ashley warning us that we are not only measuring GABA
The second thing to consider is that MRS measurements of GABA are not direct measurements of neuronal inhibition. In her video, Caroline describes that there are actually four types of inhibition (from min. 8:43), several metabolic pathways for GABA, and multiple GABA receptor types (from min. 11:49). Based on the intuitive way of thinking about GABA as a inhibitory neurotransmitter, one may expect to find negative relationships between GABA levels and brain activity, such as measured with fMRI (also see this paper for guidance for how to form and test hypotheses about the relationship between neurochemistry and activity). However, when it comes to energy expenditure and metabolism that underlie functional imaging measures, such as BOLD signal changes, things are not so simple (see this paper to show that a relationship between GABA and BOLD is not easy to find). Caroline explains how excitatory and inhibitory activity together can either increase or decrease energy metabolism, depending on the context (min. 16:36), and even more, GABA can directly modulate blood flow (from min. 22:50). Therefore, the interpretation of GABA levels, measured with MRS, is far from straightforward. Caroline (from min. 23:20) points out that the measures reflect neurotransmitter and metabolic pools, they are dependent on brain energy and activity, and they could reflect tonic inhibition. As head motion, different types of medication, and tissue composition of your voxel all can have an impact on the outcome measure, Nicolaas (from min. 27:03) recommends considering these confounding factors in your analysis and data interpretation. Additionally, menstrual cycle and time of the day have been found to be potential influencers of MRS-measured GABA concentration.

Does the uncertainty of interpretation not mean that it is pointless to do GABA MRS?
We understand that the difficulty in interpretation may be off-putting. But at this point, we want to remind you that most of the imaging measures we look at are indirect. Think about BOLD as a measure of neural activity for example. These indirect measures are still useful for inferring something about a clinical condition, and in combination with other methods, develop a more holistic picture of what is going on. In his video, Nicolaas gives a number of examples for how GABA MRS has been used in clinical research, such as in neurodevelopmental disorders (from min. 7:46), depression (min. 9:44), personality disorders (min. 11:34) and schizophrenia (min. 13:40). Due to its role in learning and plasticity, GABA MRS has also been used in healthy populations. In her video, Charlotte Stagg provides some examples of how GABA, measured by MRS, changes in perceptual learning (from min. 10:00), overlearning (from min. 16:43), and learning how to juggle, as an example of long-term learning (from min. 20:06).

Ok, so if I do want to start using GABA MRS in my research, how can I learn more?
A good place to start is to read these overview/consensus papers:

Bogner W, Hangel G, Esmaeili M, Andronesi OC. 1D-spectral editing and 2D multispectral in vivo 1H-MRS and 1H-MRSI - Methods and applications. Anal Biochem. 2017;529:48-64

Harris AD, Saleh MG, Edden RAE. Edited 1H magnetic resonance spectroscopy in vivo: Methods and metabolites. Magn Reson Med. 2017;77(4):1377-1389

Mullins PG, McGonigle DJ, O’Gorman RL, et al. Current practice in the use of MEGA-PRESS spectroscopy for the detection of GABA. Neuroimage. 2014;86:43-52

Another excellent resource is Robin’s book (which can be downloaded if your institution has access): In Vivo NMR Spectroscopy: Principles and Techniques

Finally, the MRS community has recently begun assembling a curated collection of resources for data acquisition and analysis in the form of MRSHub. The forum is a great place to pose questions that can be answered by experts.
0 Comments

    BLOG HOME

    ​TUTORIALS

    ​MEDIA

    ​contributors

    ​OHBM WEBSITE


    ​

    OHBM OnDemand 
    ​Education Platform


    RSS Feed

      blog survey

    Submit

    Archives

    February 2021
    January 2021
    December 2020
    November 2020
    October 2020
    September 2020
    June 2020
    May 2020
    April 2020
    March 2020
    February 2020
    January 2020
    December 2019
    November 2019
    October 2019
    September 2019
    August 2019
    July 2019
    June 2019
    May 2019
    April 2019
    March 2019
    February 2019
    January 2019
    December 2018
    November 2018
    October 2018
    August 2018
    July 2018
    June 2018
    May 2018
    April 2018
    March 2018
    February 2018
    January 2018
    December 2017
    November 2017
    October 2017
    September 2017
    August 2017
    July 2017
    June 2017
    May 2017
    April 2017
    March 2017
    February 2017
    January 2017
    December 2016
    November 2016
    October 2016
    September 2016
    August 2016
    July 2016
    June 2016
    May 2016
    April 2016

stay connected with ohbm!


become a member

Telephone

952-646-2029

Email ohbm

EMAIL BLOG TEAM
Header image created by Thiebaut de Schotten & Batrancourt  
www.brainconnectivitybehaviour.eu