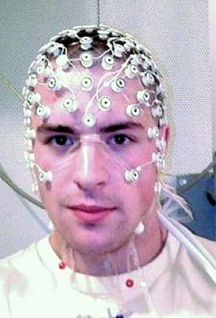
 Research participant with EEG Research participant with EEG BY LEONARDO FERNANDINO For over two decades functional magnetic resonance imaging (fMRI) has been the indisputable workhorse in human brain mapping. Its ability to localize brain activity with high spatial resolution (millimeters), coupled with its non-invasiveness, make it an excellent tool for mapping behavioral and cognitive phenomena onto detailed brain anatomy. However, since fMRI relies on changes in blood flow, volume and oxygen concentration as indicators of neural activity, millisecond-scale fluctuations in neuronal activity are not reflected in the signal. The temporal resolution of fMRI (typically > 500 ms) is therefore too coarse to track neural activity in real time and discriminate rapidly succeeding neural events. For example, some fMRI studies indicate that auditory cortical activations in response to signed language are stronger in deaf participants than in hearing individuals, raising the possibility that the auditory cortex is rewired to process visual information in deaf individuals. An alternative interpretation, however, is that visual processing of sign language occurs entirely in the visual cortex for both groups, and that activations in the auditory cortex reflect only a later, conceptual processing stage. The speed with which these processes occur makes it challenging to determine the precise sequence in which different brain regions become active using fMRI (or any other method that relies on metabolic responses, such as fNIRS or PET). Fortunately, other non-invasive techniques can provide such precise temporal information. Electroencephalography (EEG) and magnetoencephalography (MEG) directly track the electrical activity of brain cells by measuring its effects on the electrical and magnetic fields just outside the head. They allow researchers to record brain activity at a very high temporal resolution (milliseconds), close to the actual timescale of neural computations. EEG measures changes in electrical potential generated by the brain, which reflect the bulk electrical activity of many pyramidal neurons depolarizing in synchrony, through electrode leads placed on the scalp and connected to an amplifier. Researchers can then estimate the locations of the neural sources of these signals. The accuracy of these estimates depends, among other things, on the number of electrodes used, with higher numbers resulting in more precise estimates. Typically, between 64 and 256 electrodes are used.
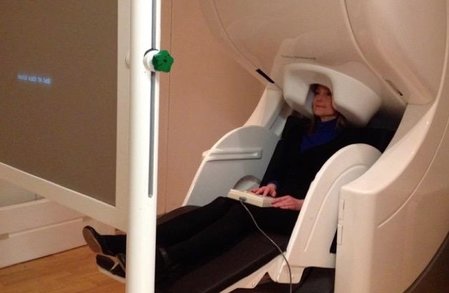 Research participant undergoing MEG Research participant undergoing MEG Nevertheless, MRI-assisted EEG source localization is becoming more common. In both cases, the inverse solution is typically computed through an iterative algorithm that searches for the combination of cortical sources whose forward-modeled signal best matches the observed signal.
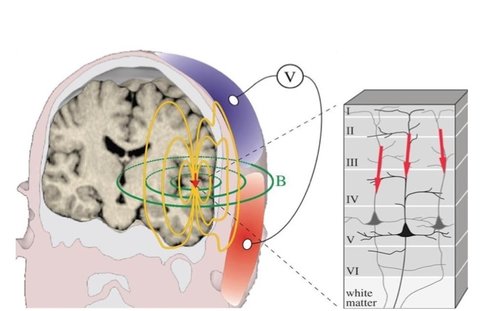
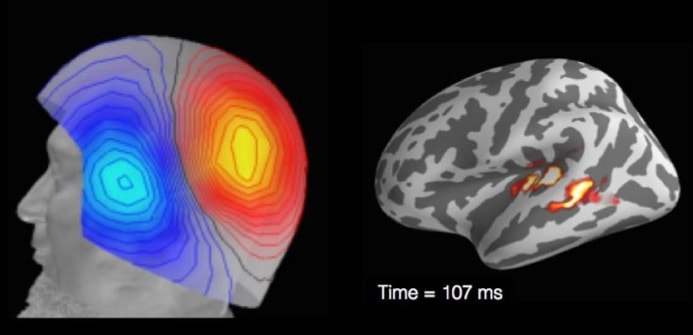
The main advantage of MEG over EEG comes from the fact that, while electrical signals are blurred and distorted by the skull, magnetic fields can traverse it virtually unobstructed. Thus, the MEG signal has higher spatial resolution, which allows better estimation of its neural sources. MEG’s main disadvantage is the cost: the scanner and magnetically shielded room run in the millions of dollars, while a high-density EEG system costs under US$150,000 (although recent advances in quantum sensing might herald the coming of low cost, room temperature MEG). Even leaving these financial considerations aside, MEG still cannot completely replace EEG (nor vice versa), since the two techniques have complementary strengths. Because a magnetic field is oriented perpendicularly to its generating current, MEG is virtually blind to activations outside the sulcal walls, while EEG is maximally sensitive to activations in the gyral crests (and somewhat sensitive to activations in the sulci). Thus, simultaneous recording of EEG and MEG can add valuable information to the source estimation procedure. Both EEG and MEG have been used clinically in the detection and localization of seizure activity in epileptic patients, which can be crucial for diagnosis and surgical planning. In research, they have been used to study a wide variety of problems, from spatial attention and synesthesia to sentence comprehension. Researchers at the University of California San Diego, for example, used them to answer the question posed earlier, of whether the auditory cortex in deaf individuals is indeed rewired for visual processing. By recording the MEG responses to signed language in deaf and hearing participants, they showed that, in both groups, activity was confined to the visual cortex in the early perceptual stage (~100 ms), and only later, during the lexico-semantic stage (~300 ms), the auditory cortex became active. This result provides compelling evidence against the auditory rewiring hypothesis. Like any technique, MEG and EEG have unique strengths and limitations. The advantage afforded by high temporal resolution is partly offset by the relatively low spatial resolution of the estimated source locations. Nevertheless, researchers who manage to incorporate these approaches into their toolkit should expect a rewarding boost in their ability to probe the living human brain.
1 Comment
3/22/2018 12:35:12 pm
This looks interesting. I googled to see how much this would cost (and I relatedly enjoyed the movie Brainstorm last month). Your comment will be posted after it is approved.
Leave a Reply. |
BLOG HOME
Archives
January 2024
|
 RSS Feed