|
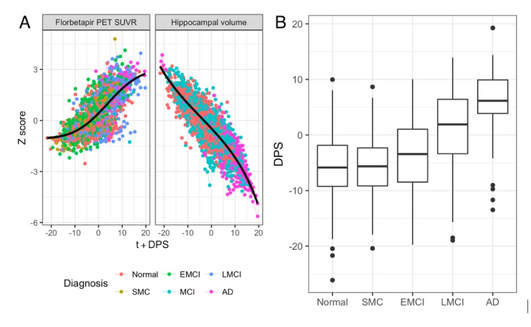
BY HUGH PEMBERTON There are over 9.9 million new cases of dementia every year worldwide, which equates to a new case every 3.2 seconds. The discovery of susceptibility loci for Alzheimer’s disease has the potential to inform research hypotheses and could, eventually, lead to novel therapies. I sat down with Marzia Antonella Scelsi from University College London to discuss her abstract on Multi-modal Imaging Disease Progression Scores as Quantitative Traits in GWAS of the ADNI Cohort. In this work, they used a mathematical model to generate an individual score for each patient based on the stage of their Alzheimer’s disease (AD) progression. Using this score, they performed a Genome Wide Association Study (GWAS) to look for any genetic markers that may be driving disease progression. Hugh Pemberton (HP): How would you explain your study to your non-neuroscientist friends? Marzia Antonella Scelsi (MAS): It is commonly known that AD is very complex and involves several different pathological processes occurring at different stages. There also exist several genetic influences but with only one very well known risk factor. The heritability of the disease is not well understood so better tools are required for studying the genetics of AD. The research world is currently looking at the genetics of each pathological process separately. However, this is likely to give only limited insight into AD, without reflecting the true complexity of the disease. We want to know what drives the onset of all the symptoms together and come up with a phenotype – i.e., a measure of the disease severity – that combines information about all the different mechanisms at play during the disease course. We integrated two different signatures of AD pathology into one measure and tried to assess the stage of AD progression for each patient (Graph A, Figure 1). Subsequently, we assigned a number to each patient based on this calculated AD progression (Figure 1B). What we get from a genetic study of this score is information on multiple disease processes at the same time.
HP: Why do you think your abstract was selected as newsworthy? MAS: I think it’s especially newsworthy because overall we need to look at Alzheimer’s disease from a different perspective at the moment, and in particular at the genetics behind it. Many studies to date have been quite crystallised in the sense that each study proposes slight variations on the same theme, or bigger sample sizes, thus always centering around Genome Wide Association Study (GWAS); but the imaging genetics community feels the need to integrate multiple, biologically meaningful sources of information in the underlying models, and that’s what we’re aiming to do here. Eventually, we hope our results can inform solid research hypotheses to be followed-up into the wet lab, animal models, and that could ultimately lead to benefits, speeding up the drug discovery process. We’ve found new susceptibility loci that could potentially translate into the clinic several years down the road. Our method is also unique because we used a mathematical model originally intended for basic Alzheimer’s research and exploited its outcome for translational application: first, by giving it a clinical interpretation, the Dementia Progression Score (DPS), which conveys the progression of each individual’s dementia, and then by using it in a genetic study. HP: You mentioned the susceptibility loci that you found – could you explain a bit more about this? MAS: We found 2 susceptibility loci, one on chromosome 4 that is very tightly linked to gene expression in the hippocampus and another on chromosome 22 that is related to amyloid accumulation and age-related macular degeneration, a neurodegenerative disease of the retina in the eye. So these two genes are both linked to the biomarkers that we used. HP: What relevance do you think these findings have? MAS: For chromosome 4, this finding underlines the fact that structural variation influences disease through a cascade of mechanisms and gene expression is key, so you need to intervene at the molecular level to establish a normal gene expression pattern that has been disrupted by these variants. For chromosome 22, the findings are more newsworthy because we appear to have two diseases, AD and age-related macular degeneration, that are apparently different but happen to share a genetic susceptibility locus. This means that, if we can target variation in chromosome 22 to find a potential treatment for one disease, we might be able to slow down the progression of the other, thus killing two birds with one stone, idealistically speaking! HP: What are your next research steps going to be given these findings? MAS: We’re currently working on refining this model since it can be problematic when only using a few biomarkers. We want to expand it to more biomarkers. HP: What sort of other biomarkers would you like to include? MAS: One of my colleagues has developed a reliable tool for segmentation of hippocampal subfields [1]. Therefore, I am working on preliminary analyses to see if any subfields are differentially affected in late or early stages of AD in order to include them in the disease progression model, and hopefully achieve more fine-grained disease staging results. I’ll also add biomarkers like cognitive scores. While amyloid build-up is most likely a prodromal event and hippocampal atrophy is characteristic for mid-stage AD, for characterising later stages of disease progression I think cognitive scores are the best choice. The aim is to include biomarkers from all stages of AD progression in my model. We want to characterise the full spectrum of the disease and hopefully identify genetic variations underlying the whole course of the pathology. [1] Iglesias JE, Augustinack JC, Nguyen K, Player CM, Player A, Wright M, et al. A computational atlas of the hippocampal formation using ex vivo, ultra-high resolution MRI: Application to adaptive segmentation of in vivo MRI. Neuroimage 2015;115:117–37. doi:10.1016/j.neuroimage.2015.04.042.
0 Comments
Your comment will be posted after it is approved.
Leave a Reply. |
BLOG HOME
Archives
January 2024
|

 RSS Feed